
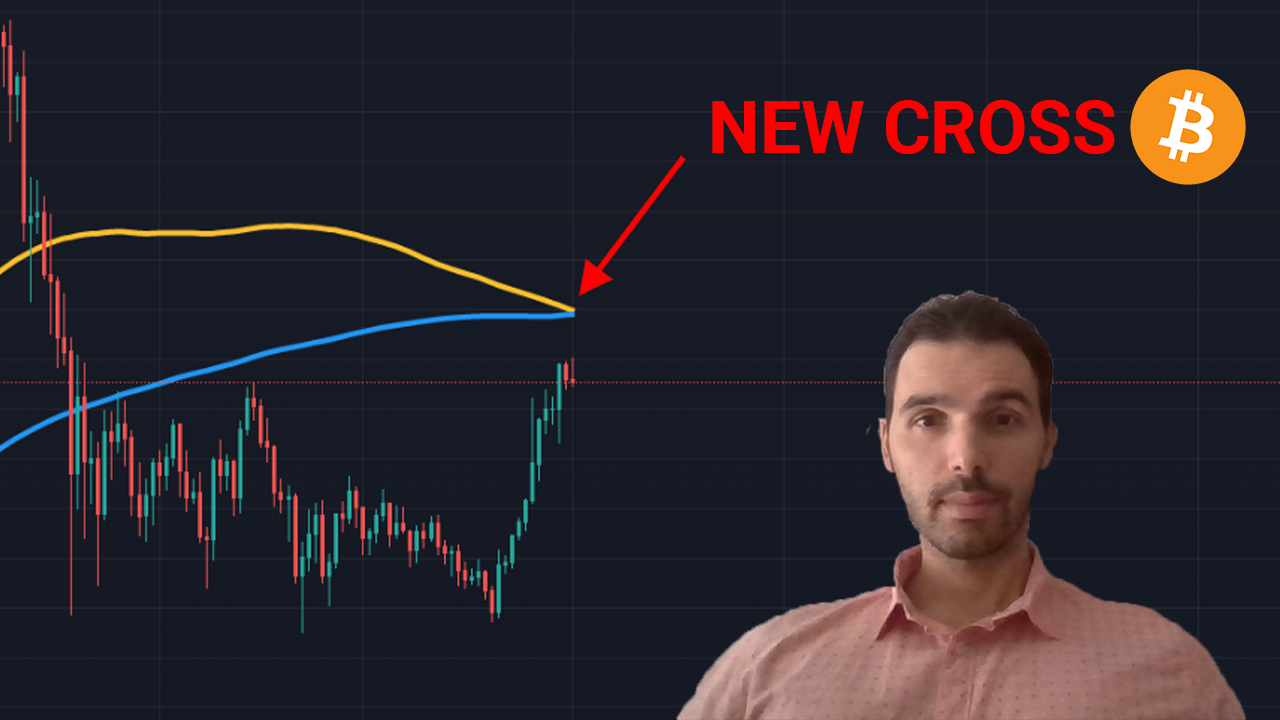
As we enter August 2021, new significant events will define how we craft our bitcoin price prediction analysis. A vital cross is coming soon, a critical resistance point is coming with it, and we need to brace ourselves.
In this article, we see the essential milestones to confirm the bull cycle and be cautious of potential traps.
If you find this content useful, please bookmark Econalerts, so you won’t miss any new bitcoin price prediction reports.
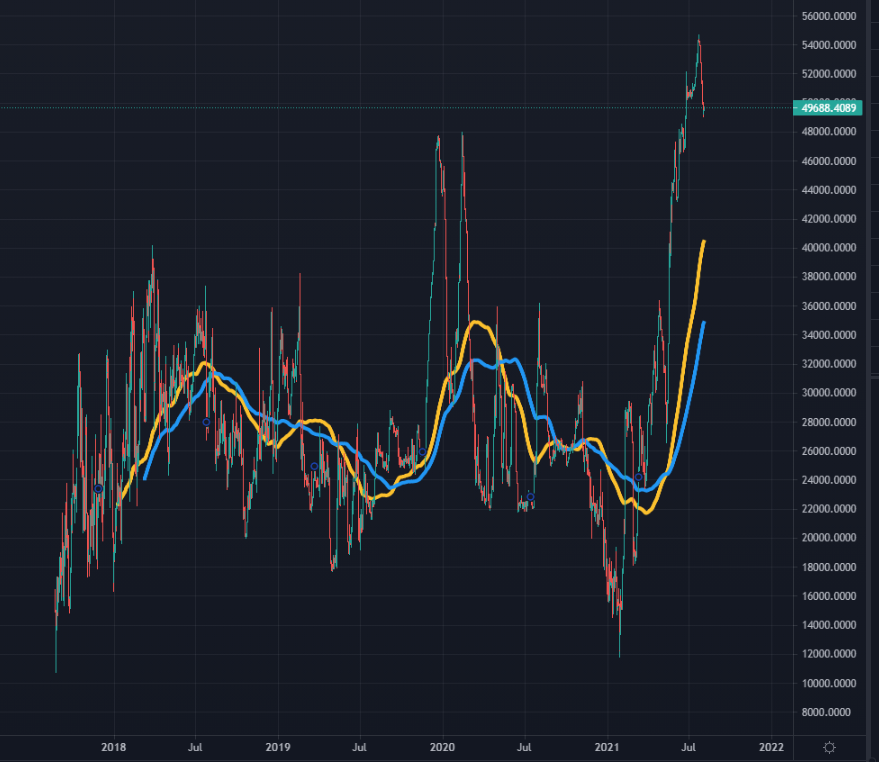
In our analysis, we discuss the status of one of the three most commonly used moving average metrics to determine the potential status of the cycle.
Those three averages are:
- 21w EMA (red line)
- 20w SMA or 140d SMA (purple and yellow line, respectively)
- 200d SMA (blue line)
Bitcoin price prediction milestones
Bitcoin has recently made a significant step towards reclaiming the bull cycle by going over the 21 week EMA – aka exponential moving average, which is currently at appx $39,400.
Not only, we break above this point, but we also came down and bounced off it with momentum. The first milestone is confirmed.
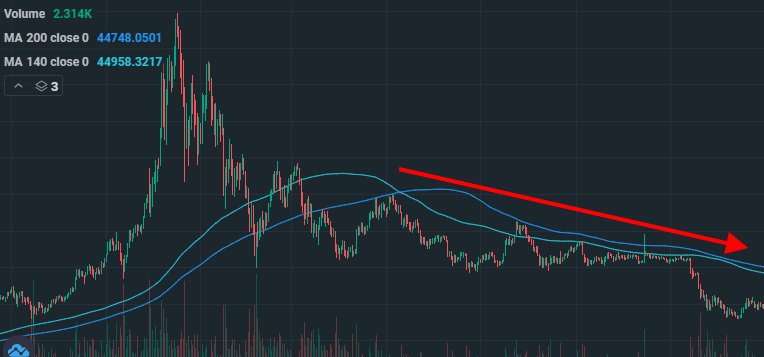
The second milestone is the 20 week SMA, which is not at around $45,500 but following a downward trend, getting diminished by appx $1k every week.
This point not only needs to be broken but needs to hold as support if we expect to continue this short-term bull momentum.
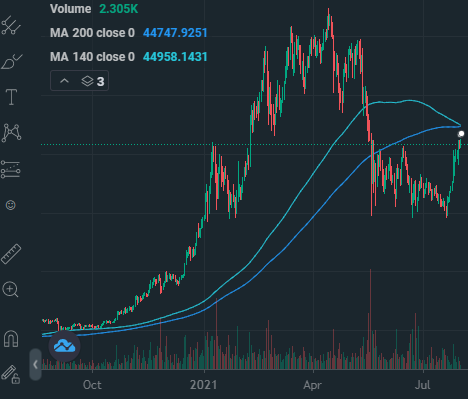
The 3rd important milestone is the 200 day SMA, which is now at $44960: you can see it here in the yellow line.
Here’s where it gets interesting. The 200 SMA and the 20 week SMA will likely get crossed by tomorrow. This is more clear when we use the 140day SMA (yellow line), which is on a course to meet the 200 SMA (blue line)
Those averages are often used as proxies to determine if we are in a bull market or not. Their meeting point is close to $4500. This convergence makes this price point even more significant. The whole bull market case depends on it, so you can expect that the bears will try to defend it at all costs.
Without having both the second and third milestone completed, our bitcoin price prediction analysis, will depend on several key price points.
IF (big IF) on the short-run, we manage to break above the 45K level with momentum, the correct down to it, and most importantly bounce off it, then yes, this is a very, very strong bull cycle confirmation. But before this happens, anything is possible.
If bitcoin’s fails to break this resistance, then a strong downside is to be expected. Without having both the second and third milestone completed, our bitcoin price prediction analysis, will depend on several key price points.
Historic patterns
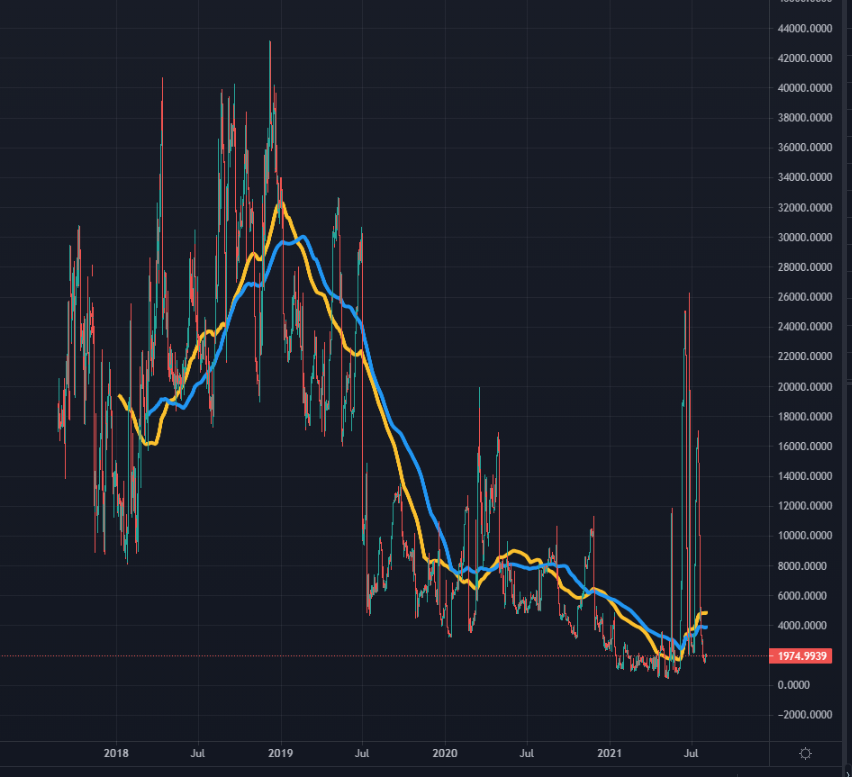
What happened in the similar cross during the previous bull runs? Previous patterns will help us determine the bitcoin price prediction’s most possible targets.
This chart shows what happened in 2018 when those averages met. The price crashed, and we entered a prolonged bear market.
Let’s go further back/ What about the 2013-14 doubly top bull run, which many analysts (including me) believe will resemble our current run, even though it will have a much extended time frame.

An issue here is we can’t find reliable data for 13-14 cause very few exchanges were trading BTC in the early months of 13 (SMAs are lagging indicators ), but in bitfinex it shows that the cross happened AFTER the double peak, and despite a good pump the trend was downwards after
Using only two previous bull cycles as reference points isn’t itself a statistically reliable price predictor. Still, it can point to us if there is a bearish bias or not.
Bitcoin price prediction summarized
It’s all a game of chances, so in my view, if we support the $45 without issues, then the bull market chances are pretty high. Now it’s too risky to tell, and I consider the 39k-45K range a no-trade zone
if the price exceeds 45k, then once it corrects, it bounces at 44.5-45k and remains above. holding 45k as support will be the best confirmation to enter with a long order.
If the price rejects from 45k, expect the oscillation in the 30-40k range to continue for a few more weeks or months.
Therefor this bitcoin price prediction strategy suggests that if we do break to the down side, any purchase at the low 30k range may be a good buy.
Similarly, this bitcoin price prediction approach will suggest that going long between 36k-45k may not worth the underlying risk.
Last remarks: Bitcoin longs and shorts
One last part I want us to have a quick look at is the Bitcoin shorts and longs charts on bitfinex.
Bitfinex’s BTC shorts are close to the lowest level in their history since 2017.
BTC longs are close the the highest level in their history.
Even though being in a downward trend, Bitcoin longs remain among the highest levels in its history.
This can be an actual contrarian indicator, showing that the markets have not been shaken well enough, and a long squeeze may be well into play before we have and decisively confirm the new bull cycle.
Hope you enjoyed our August 21 bitcoin price prediction analysis. Please have in mind that this is NOT financial advice, but just informational content.
Also, check the full YouTube video analysis here
For for more recent price analyses check our investing journal entries.
See you next month.