

How to invest in stocks for beginners
Investing in the stock market is easier than most amateur investors might think.
This guide prepared by professional investors and awarded academics will help you to successfully invest your money in the stock market and avoid the most serious pitfalls across the way.
As you might already know, in the last 100 years stocks’ returns have largely outpaced all other traditional investment assets (i.e., certificates of deposits, bonds and gold). An investor in 1950 who invested equally shares of $20 in the stocks of the 500 largest companies in the USA (i.e. initial investment $10,000) saw his investment reaching the stunning amount of $1,45 mil in 2020!
Below we can see the performance of S&P 500 in the last 90 years.
S&P 500 is a market index that mimics the accumulative performance of the 500 largest by market capitalisation U.S. companies.

Skilful investments in stocks is perhaps the most effective way to build long-term wealth.
In this article we are addressing the question how to invest in stocks by comparing the three most popular strategies:
- Stock-picking
- Investment in mutual funds
- Investments in ETFs
In addition, we are presenting the three most effective ways of how to invest in stocks online:
- Investment platforms
- Financial advisers
- Robo-advisers
Stocks, shares and equities for the purpose of this article are considered identical and they will be used interchangeably
Stock-picking or diversification?
There are multiple ways to invest directly or indirectly in stocks but in this guide, we will talk only about the three most popular. You can choose any of the following approaches or a combination of them.
The investment strategy you choose depends mainly from your investment aims, your risk profile, your investment proficiency, your budget constraints and how actively you would like to manage your investment portfolio.
Stock-picking (investment in individual equities)
If you already spend endless hours reading the Financial Times and Bloomberg trying to figure out what kind of news moves the stocks of individual companies then stock-picking is the ideal strategy for you.
Stock-picking is when you choose stocks based on research and intuition.
Nonetheless, reading corporate news is not enough to decide which are the best stocks to invest in.
Great investors like Warren Buffet and Sir John Templeton at the beginning of their career spent endless hours analysing on their own tons of financial statements and ratios of hundreds of public companies before deciding on which companies to invest their few bucks.
This process is called fundamental analysis and if you want to dig into it you have two options. Either to enrol in a BSc or MSc Finance course or start reading financial analysis textbooks.
Invest in Equity Mutual funds
A mutual fund is an investment company that pools the money of many individuals and invests them in multiple stocks, bonds, or other assets.
Mutual funds that invest exclusively in stocks are called equity mutual funds.
When you invest in a mutual fund it is like buying indirectly shares of all these companies the fund invests in. In essence, the fund manager and his team are analysing a huge amount of corporate data with the help of supercomputers and pick the best shares according to the investment aims of the fund. In return, for their services they receive an annual management fee.
In mutual fund investing, an investor’s role is limited in picking the right funds according to his investment aims and by analysing the funds’ ratings provided by financial companies such as Morningstar.
Buy Equity ETFs
Equity ETFs are essentially similar to mutual funds since they also hold portfolios of various equities in order to minimize risk by spreading investor’s money in different investments.
Their main difference is that ETFs can be traded like stocks while mutual funds can be acquired or sold only at the end of any given trading day based on a calculated price.
In addition, ETFs are mainly managed passively since they track the performance of a specific market index (i.e. S&P 500, Nasdaq 100, FTSE 100) while Mutual Funds are managed actively based on fundamental and technical analysis.
Active management is the reason why the average total annual fees of mutual funds are six times higher than those of ETFs (1.5% vs 0.25%). Unfortunately (for the fund managers), we cannot say the same about the returns.
In the last 75 years the four largest ETFs (SPY, IVV, VTI, VOO) outplayed the performance of the 96% of actively managed funds and the 75% of the funds managed exclusively by Ivy League Universities (i.e. Harvard, Yale, Princeton etc.).
In the graph below we can see the performance of the average equity fund in comparison with SPY the largest ETF tracking the performance of S&P 500.

How to start investing in stocks
Regardless of the strategy you choose, there are only three ways to trade stocks or funds: through an online investment platform, with the help of a registered investment advisor or with the assistance of a roboadvisor.
The ideal method will be the one that lines up with how much guidance, time, and effort you would like to invest in picking and managing your stocks.
a. Online investment platforms (brokerage account)
For those who have a basic understanding of the main principles of investing, opening an online platform account is perhaps the most cost-effective way to trade stocks.
Choosing the right platform might be a pain in the neck for this reason we tried and compared the best investment platforms for you.
b. Hire a registered financial adviser
In case you prefer a passive approach in investing and you are mainly interested in creating a balanced portfolio with a middle-term or long-term horizon then you should consider asking the help of a professional investment advisor.
An investment adviser initially helps you to determine your investment strategy (i.e. your risk-aversion profile, your budget constraints and your investment horizon and aims). Then he purchases on behalf of you stocks and manages them according to your investment strategy.
Investment advisors charge a management fee (per-trade fee or flat annual fee).
The best investment advisors have multiple years of experience and are holders of a CFA title.
c. Use a robo-advisor (online advisors or automated investing services)
Roboadvisors are virtual investing advisers that use sophisticated computer software and algorithms to create and manage your investment portfolio according to your investment profile and aims.
Their services range from automatic rebalancing (i.e. selling and buying stocks automatically according to changing market conditions) and tax optimization. Roboadvisers typically charge lower fees than financial advisors and rarely do they have a requirement for a minimum investment amount.
Nevertheless, they are not humans, so they are not able to answer any questions.
No matter the investment method you pick to participate in the market, bear in mind that management fees and services costs play a significant role, and they can significantly reduce gross returns.
Specifically, there are transaction fees for selling or buying stocks or funds, there are ancillary charges or custody fees for retaining an investment and there are annual management fees.
According to Harvard Business Review in the last 50 years gross returns for passive equity funds were reduced by 15% by management fees and those of actively managed funds by a staggering 45%.
According to another research of the Stanford University the 25% of investors in the last 25 years have negative or zero net returns if we consider the fees.
Important Terms
Before start analysing the forces that drive the stock market we should get familiar with the following terms:
- Dividends
- Preferred stocks
Dividends
Inexperienced investors are often oblivious of the fact that “buy low sell high” is not the only way to make profit from stocks.
Dividends are the reason why Rockefeller became the richest man in US history. Rockefeller created the largest monopoly known to history by luring small refiners to sell their oil wells and receive in return shares of his company, Standard Oil.
But what enticed the investors was not just the Standard Oil’s stock prices prospects but Rockefeller’s pledge to pay large dividends even when the oil prices decreased. And he did that with unwavering commitment for more than 25 years, even when the prices of oil tumbled by more than 85%.
But what is a dividend and why do companies pay it?
Extremely profitable companies end up with excess cash that cannot be allocated in existing or future projects. This amount instead of being invested is distributed as a payment (reward) to the company’s shareholders.
Blue chip companies pay dividends to send a powerful and clear message about their future profitability and prospects, and their determination and ability to pay steady dividends as an indicator of their financial prowess.
In the last 40 years more than 70% of S&P 500 companies regularly pay a dividend which in many cases exceed the return of the 10-year treasury bond (i.e. >1.5%)
Preferred stocks vs common stocks
There are two types of stocks on the market: common stocks and preferred stocks.
Both types of stocks entitle the buyer with an ownership share of the company and they can be easily bought through an investment platform or an investment advisor. Despite their many similarities the two types of stocks are not identical.
Their main difference is related to dividends.
Preferred stock shareholders receive fixed dividend payments according to a predetermined schedule, unlike common stockholders, who receive variable dividend payments. In a sense, preferred stocks share some similarities with corporate bonds that give to the holders fixed payments called coupons.
In addition, if the company bankrupts, owners of preferred stocks receive pay-outs before common stockholders but not earlier than bond holders and creditors.
Which forces drive the stock markets?
In 1973 Burdon Gordon Malkiel, a celebrated Princeton Economist, published one of the most popular investing books of the 20th century, entitled «Random Walk Down Wall Street».
In one of the book’s most controversial statements Malkiel claims that: «a blindfolded chimpanzee who throws darts at a newspaper’s financial pages where all stocks are listed could create a portfolio that will outperform those created by the majority professional fund managers in Wall Street».
His bold statement was put to the test many times and the findings were stunning.
The monkey-portfolios in some cases beat more than 75% of professionally formed portfolios.
Should this deter you from investing or should you look for a capuchin monkey for the nearest pet shop? Probably none of them (even though a pet monkey might seem more appealing).
If you leave your money in the safe deposit box, then you will certainly have negative returns due to the damaging effect of inflation or even the risk of confiscation if the next Great Recession strikes.
The lesson from the Random Walk Hypothesis is that you should never overestimate your oracle skills, you should abide by the principles of diversification and asset allocation, and always ask for the management fees schedule.
Now that we have established the respect the markets deserve, we can try to understand which forces drive the equity prices. Generally, these forces can be classified into three broad categories: fundamental (or microeconomic) factors, technical factors, and behaviour factors (or market sentiments).
(1) Fundamental Factors
A company’s stock behaviour most of the times reflects the actual and the expected profitability of the company.
Whether a company will report higher or lower than expected profits is mainly a mystery for the average investor. Nonetheless, in the annually published financial statements we are given a precious glimpse into the company’s prospects.
Based on the quarterly and annual financial results we can create ratios (called fundamentals) that will help us to determine whether the current stock price of the company is (over/under)valued.
If the market price of the stock is lower than the «fair price» suggested by the fundamentals, then the stock is said to be undervalued and we should consider jumping into it.
Value investing, i.e., buying undervalued stocks of companies with good profitability prospects, is praised by most of the traditional investment legends including Warren Buffet.
«Stick to the fundamentals. That’s how IBM and Hilton were built. Good things, sometimes, take time» – Wall Street (1987 film).
Even if you do not have the time to run a full fundamental analysis yourself, understanding the key fundamentals can certainly help you to decode the behaviour of stocks and make more wise decisions.
(1.1.) Earnings are King!
Investors should scrutinize a wide range of data and ratios, but undoubtedly the first data point to look for is corporate earnings. Earning tell us how much money the company is making and how much money is probably to make in the future.
To put it differently, earnings are the crystal ball of a company’s future profitability.
Public companies are obliged to report earnings quarterly and an army of financial analysts are waiting eagerly in the trenches of Wall Street to analyse them. Nevertheless, this raw information is useless without understanding the basic accounting principles.
If you want to get into investing you should understand how the financial statements are created (especially the income statement) and learn basic accounting terms, such as EBITDA and OPEX.
As a rule of thumb when a company reports that earnings are higher than expected, that generally leads to a higher equity price. On the other hand, when earnings are lower than expectations the price drops.
(1.2.) Fundamental Analysis Ratios
Earnings are of paramount importance, but they do not tell you the whole story. To build an objective picture of the how the stock is valued you will need to incorporate other more advanced fundament analysis ratios (or tools).
These ratios are calculated on earnings, sales, dividends, book value, equity price.
Most of these fundamental ratios (or tools) can be found for free in Bloomberg or Yahoo Finance, but you need to calculate them on your own to understand their real predicting power.
These are just the basic ratios to start with:
EPS (Earnings per share)
The most widely used indicator of a company’s profitability is EPS.
This ratio shows the amount of profit assigned to each equity and it is calculated by dividing the company’s net income with the number of shares outstanding.
EPS is a solid indicator of the company’s health, since the higher the EPS the higher the returns for the investors.
P/E ratio (Price-to-earnings ratio)
This is the favourite ratio of Bill Ackman one of the greatest activist investors of 21st century.
It is calculated easily by dividing the share’s market value with the EPS and it examines whether the company’s performance is fairly reflected in its stock price.
The formal definition of the P/E ratio is that it shows the dollar (euro) amount an investor can expect to invest to receive one dollar (euro) of that company’s earnings.
What you should know is that a low P/E means that the stock is probably undervalued, and it signifies potential rise in the future.
At this point we should warn that all ratios we examine should be used prudently and with an open mind.
Bill Ackman through Valeant Pharmaceuticals (VP) entered a disastrous game of aggressive acquisitions of a significant number of pharmaceutical companies in USA and Canada based on their low P/E ratio. Unluckily for him all these companies were in essence overvalued and VP was forced to inflate the drug’s prices leading to a series of unsettled lawsuits (a Netflix Documentary vividly presents the details).
Return of Equity (RoE)
As you might know companies have two main sources of financing: debt (i.e. bank loans) and equity (i.e. shareholder’s money). RoE focuses on shareholder’s contribution.
In particular, the ratio shows the company’s effectiveness to produce profits on its shareholder’s money and it is calculated by dividing net earnings with shareholder’s equity.
Shareholder’s equity is an accounting term, and it can be found in the accounting statements.
ROE is calculated by dividing the Net Income with the Shareholder’s Equity and it measures the profits made for each shareholder dollar. ROE is expressed in percentage terms.
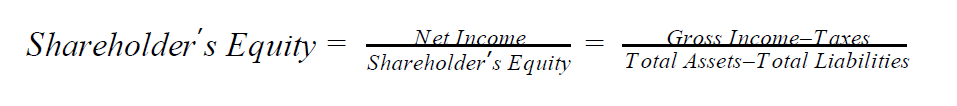
A high ROE is an indicator of corporate robustness and it shows that the firm can increase its profitability without any additional investment capital.
As a rule of thumb, an average ROE of 15 shows a strong company with good profitability potentials.
Nevertheless, as the formula reveals a company with few assets can also have a deceitfully high ROE leading to erroneous conclusions. Most Nasdaq companies have a high ROE, while car manufacturers have a comparatively low. Therefore, when we use this ratio we should compare companies withing the same sector or industry.
Price-to-book (P/B) ratio
Initially, a company’s book value (BV) is the difference between its tangible assets and its obligations against creditors (liabilities).
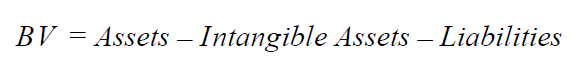
An intangible asset (such as brand recognition, trademarks, copywrites) is a type of property that does not have a physical presence, i.e. it is abstract. It gives value to the company, but it cannot be objectively assessed for this reason it should be excluded from BV.
The P/B ratio is calculated according to the following formula:
This ratio is easier to read since if the P/B < 1 then the share is considered to be undervalued and a good investment opportunity.
These are just few of the main fundamental analysis ratio. Even, if you are not able to calculate them you should understand them and they will become a great assistant in your effort to track the performance of your portfolio.
(1.3) News and inside information
In 1982 two Chicago Booth School of Business graduates started their employment in the largest finance newspaper in USA, Wall Street Journal.
Six months afterwards they were charged with insider trading.
Insider trading is the trading of a public company’s equities based on non-public information about the company’s prospects and profitability.
As it was later proved, the two graduates had access to corporate news before they were published and based on this news, they were trading large amounts. The SEC men in black spotted them and their career ended disgracefully.
Information, in finance is everything.
Access to non-public information is not the only way to capitalize the ignorance of your fellow investors. Most of investors seem to skip and belittle important public information on business.
Read the news proactively and try to understand how corporate news might affect sales, revenues, costs, and management. Inevitably, all information should be reflected on the stock prices.
(2) Technical Factors
In 2019, two times more MIT engineer graduates were employed in investment analyst internship programs by Wall Street firms than from NASA.
Two decades earlier not even one engineer from an Ivy League university was employed as an analyst in Wall Street!
What changed?
To understand this, we should leave the rational world of fundamental analysis and enter the realm of technical analysis.
In finance, technical analysis is the closest we have to wizardry. Exactly as alchemists were spending endless hours in their humid laboratories to detect the philosophical stone that can transform all metals to gold, technical analysts are looking for the magical equation to predict the stock prices movements.
And when it works it can transform an amateur dancer to a millionaire (Nicolas Darvas success in the stock market through technical analysis could easily become the next Hollywood blockbuster)
(2.1.) What is technical analysis?
Technical analysis is the school of investing that tries to detect trading opportunities by processing statistical data (mainly past prices) and trends.
In contrast to fundamental analysis, which attempts to assess an equity’s value based on business results such as profits, sales and earnings, technical analysis concentrates on the study of price and volume.
The proponents of technical analysis postulate that the past behaviour of a stock can be a valuable indicator of the stock’s future price movements.
The irony is that in the small print of all agreements of technical analysis investment companies is meticulously written that «past performance is not guarantee of future results». But the whole existence of technical analysis is based on the premise that a stock’s past performance is the window of future performance.
(2.2.) Main technical analysis indicators
The main financial indicators of technical analysis can be categorized as follow:
- Chart patterns
- Oscillators
- Moving averages
- Volume patterns
- Resistance and support levels
(2.1.) Chart patterns
Chart patterns are shapes within a price chart that indicate what stock prices might do in the future, based on what they have done in the past.
In the picture below are presented few of the most long-established indicators

Source: https://in.pinterest.com/pin/284852745170270443/
The way to read them is not challenging as it might seems.
For example, let’s focus on the “Head and Shoulders” diagram of the picture below:

If an analyst is analysing this price diagram at the moment when the price is on the fifth peak (i.e. LH) he should sell (or short) the equity since based on the patent the stock is expected to fall.
(2.2.) Oscillators
Oscillator is a technical analysis tool helping us to decide whether a stock is overpriced (overbought) or expensive (oversold) based on its short-term behaviour. By using simple mathematical formulas we construct low and high bands between two extreme values, and then we draw a line that runs within these limits or bounds.
Nevertheless, you shouldn’t stress about mathematics since oscillators are provided by all investment platforms.
As we can see in the picture below on the upper part of our diagram is the actual fluctuation of the stock’s price while below is our oscillator.
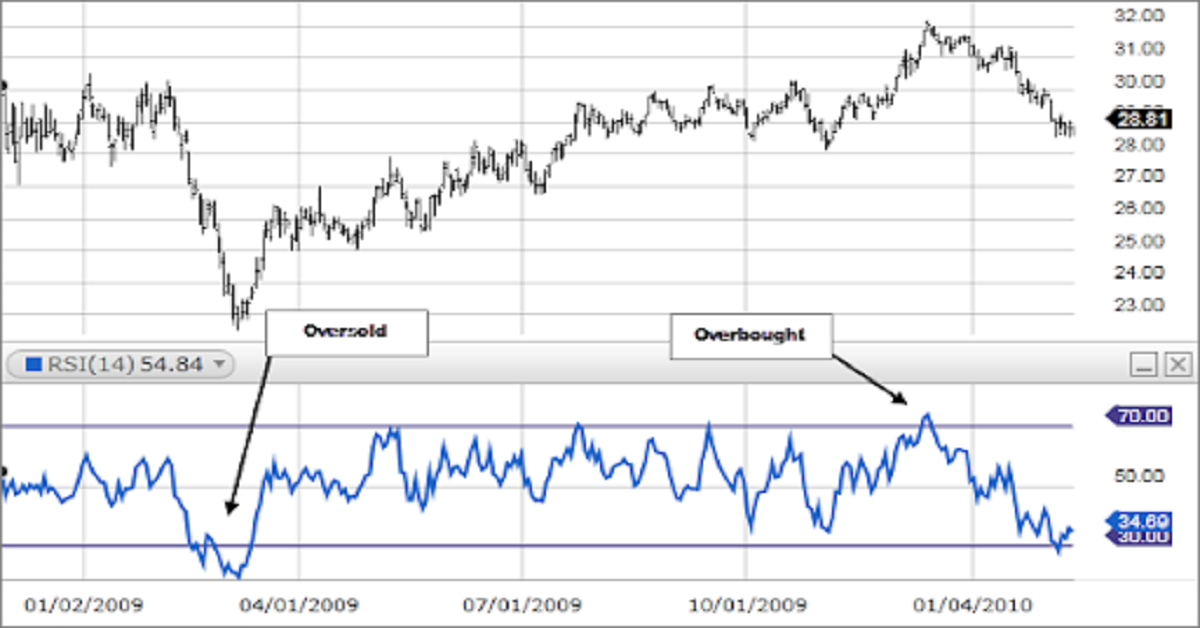
When the value of the oscillator reaches the higher band it means that the equity is expensive and we should probably sell it.
The most popular oscillator is the RSI (Relative Strenght Index).
(2.3.) Moving Averages
Moving averages (MA) are one of the main indicators in technical analysis. There are countless versions of MA but the easiest to calculate is the Simple Moving Average (SMA). SMA is simply the average equity price over a specific period of time (e.g. 100 days, 200 days etc.).
The reason why this average price is called moving is because it is drawn on the chart by forming a curved line that moves along the diagram as the average value changes.
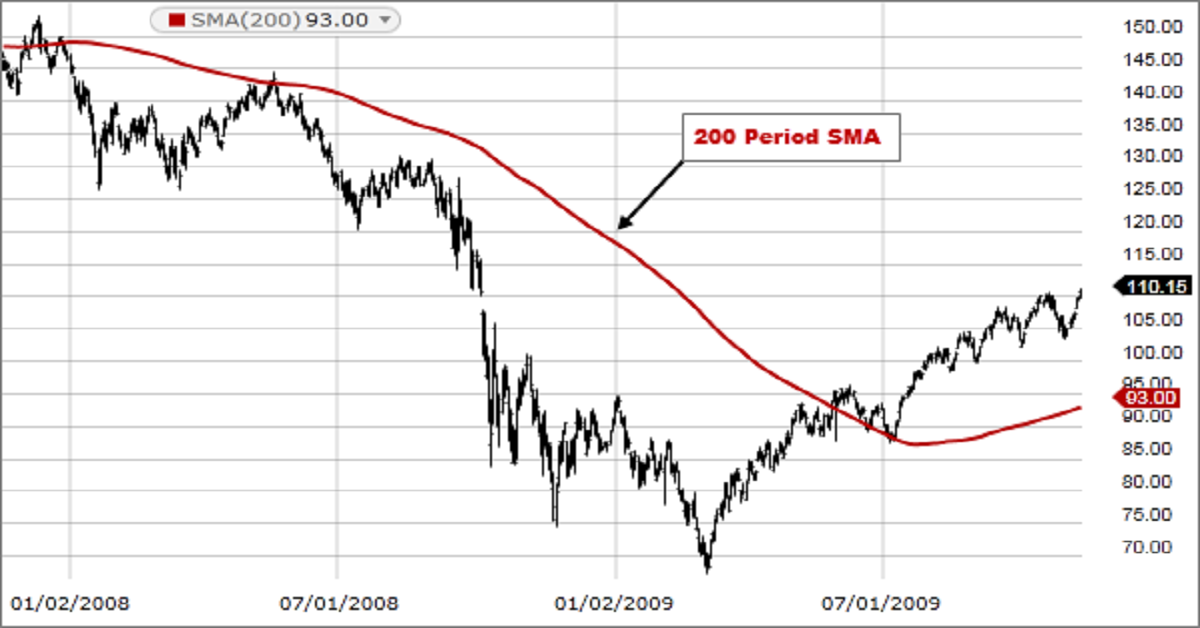
MAs are used to determine trend direction. If for example the MA is increasing, the trend is up, and probably the price will continue climbing so we should buy. A 200 days period SMA is a popular indicator of the long-term trend of an equity, while a 50-day SMA is usually used to calculate the middle-term trend.
(2.4.) Volume patterns
Volume is the number of shares traded over the course of a day.
Analyzing volume patterns help us to get a sense of the strength behind declines and increases of specific stocks.
In the following table we can see how technical analysts interpret swifts in prices and volume short-term
| Prices | Volume | Trend Interpretation | Action |
| Rising | Rising | Healthy up-trend | Buy |
| Rising | Falling | Healthy down-trend | Hold |
| Falling | Rising | Trend Weakness | Sell |
| Rising | Falling | Trend Weakness | Sell |
(2.5.) Resistance and Support Levels
Resistance and support are certain levels of the price of an equity at which it is thought by many investors that the price will tend to stop and reverse.
Resistance and support are certain levels of an equity’s price at which it is believed by many investors that the price will tend to stop and follow an opposite direction.
Specifically, a support level is the price where the equity tends to get stabilized as it decreases in value. On the other hand, a resistance level is when the equity’s price tends to face some difficulties as it increases in value and it will probably reverse.
Let’s consider the following example.

In order to detect these levels quickly, we circle all relatively isolated peaks and then we are looking for the horizontal lines that intercept most peaks.
(3) Behavioural Factors
Did you know that:
- On Monday stocks’ returns are likely to rise if on the previous Friday returns were also rising.
- Non-US investors prefer to buy equities of small companies of their native country rather than stocks of large international companies such as Microsoft, Amazon and McDonalds.
- The first trading day after the Super Bowl NFC champion is crowded the stock prices are more likely to rise.
- More than 75% of amateur investors avoid investing in the stock market for at least 10 years after they lose more than 50% of their initial capital.
- Three days before Christmas stock prices have two times more probability to rise rather than to fall.
- In a bear market, amateur investors are more likely to sell when the stock price decrease moderately (i.e. 5% – 10%) rather when they fall steeply (i.e. 20% – 50%)
All these irregular phenomena are called “behavioural effects” and they show that we often trade with our hearts and not with our heads.
Psychological factors such as excitement, agitation and fear inevitably affect our trading behaviour.
The main stock market crashes of the last 120 years (1929, 1971, 1999, 2008) were so massive and destructive not only because the economic conditions were significantly worsened. But mainly because investors overreacted due to fear and uncertainty.
Objectively the current economic conditions are worse than in 1929. But stock markets do not seem to react in the same aggressive way. Why? Because the crowd psychology of investors is more effectively controlled by media and opinion leaders.
If you want to have a better understanding of financial crashes and bubbles you should dive in behavioural finance.
(3.1.) The most important behavioural factors
Herd Instinct
When a great number of investors passively mimic the behaviour of most investors, this is called herd instinct. To put it differently, when investors buy only because everyone else is buying and sell because everyone else is selling, then science and financial analysis become irrelevant.
In this case, the best you can do is to follow the stream. Do not try to use contrarian investing because you will probably lose.
The infamous film The Big Short (2015) tells the story of Michael Burry, an eccentric fund manager who predicted the subprime loan crisis in the USA in 2007.
Burry through his analysis predicted that the economic bubble would reach its end at the beginning of 2007. This conclusion led him to bet against the market by persuading investment banks such as Goldman Sachs to sell him CDS (Credit Default Swaps). The financial market indicated its first signs of weakness in November 2007. Until that time Burry’s investment company was losing millions and Burry suffered an investor revolut. Nevertheless, at the end Burry was proven correct and his investment fund earned a profit of $800 mil.
The lesson from this story is that even if your gut tells you that you are correct, what drives the markets is not always the collective wisdom but the collective stupidity.
Warren Buffet advises to be fearful when others are greedy and greedy when others are fearful.
Loss Aversion
Most investors are so afraid of losses that they focus on trying to avoid a loss more than trying to make gains. Research shows that amateur investors feel the emotional pain of a loss two times more intensively than the joy of making a profit!
Amateur investors mistakenly do not recognize a loss until it is realized. Hence, to avoid experiencing the emotional pain of an actual and realized loss, they will continue to hold a financial asset even as their losses from it grow. Subconsciously, they think that the loss doesn’t count until the position is closed and the investment sold.
The lesson here is to learn to control your fears and trust your research. Short-term markets can be extremely volatile and “noisy”. You should learn to ignore this noise and focus on your middle-term and long-term aims.
Equity Home bias puzzle
Research showed that Individuals in most countries hold only modest amounts of foreign equity and they seem to prefer their local stocks.
This behaviour is associated with the illusion that you have a better understanding of the corporations operating in your country
Penny Stocks
If you watched the film “The Wolf of Wall Street” (2013) you might remember the cunningness with which Leonardo Di Caprio was pitching stocks of small businesses to large investors. Stocks of small companies are called penny stocks. More precisely, penny stock is an US equity that trades at less than $5.
The question of how to invest in penny stocks is not so straightforward.
Although penny stocks trade on major exchanges like the NYSE, most of the transactions are made over-the-counter (OTC).
Penny stocks are often associated with middle size businesses and trade infrequently. Practically, this means that sellers may have difficulty selling their stocks if there aren’t investors available to acquire them on time.
Nevertheless, they deserve a part in our analysis since many of the great investors started their career by investing in penny stocks.
Penny stocks offer significant upside potential for share appreciation much higher than those of blue chips and S&P 500 companies.
The main disadvantage of penny stocks is that investors might struggle in finding the desired market price due to the lack of liquidity.
In addition, limited information is available about the financial records of the company. Therefore, you do not know what you are buying.
Finally, penny stocks are susceptible to fraud and bankruptcy of their underlying companies.
If you are interested on how to invest in stocks through ETFs check out the following providers
| Logo | Broker | EconAlert Rating | Fees | Account Minimum | Vist Website |
| Saxo Bank | 5 | $0 | $0 | learn More | |
| Interactive Brokers | 5 | $0 | $0 | Learn More | |
| E*Trade | 4.8 | $0 | $0 | Learn More | |
| TD Ameritrade | 4.8 | $0 | $0 | Learn More | |
 | J.P. Morgan W. M. | 4.7 | $0 | $0 | Learn More |
Bottom Line
As you might already have concluded, how to invest in stocks is not so easy.
In Econalert we firmly believe that “stock trading” is not for beginners!
We firmly recommend that you use Equity ETFs for a middle-term or long-term strategy until you learn the underlying principles of macroeconomics, finance and investing.
The goal of every investor is to sell low and buy high.
History has shown that you are more likely to achieve this goal if you keep a long-term diversified investment such as an ETF.